Most practices know how many patients they saw last month. Far fewer know how many hours their rooms sat empty while the doors were open. That second number is operatory utilization, and it is the one that tells you whether your problem is demand, staffing, or the way the day is put together.
The definition is simple enough to write on a napkin. Utilization is the share of your open hours that your rooms were in use. Everything else in this article is about measuring the two halves of that fraction honestly, and the first half — the denominator — is where the arguments happen.
Step one: open chair time
Open chair time is the denominator, and getting it wrong is the most common reason two people in the same practice quote two different utilization numbers.
For one operatory, open chair time is the hours the practice was open for patients. Take out the periods the whole practice is shut — a scheduled lunch when nobody is chairside, a half day the office is closed — and that is the lot. Nothing comes out for one room in particular: not a thin roster, and not the morning a chair was out of service for repair, because the rent and the finance on that chair did not pause for the repair either.
It does not mean “hours a provider was rostered.” A room with nobody assigned to it is still a room you are paying for, and hiding that behind the roster is how a practice convinces itself it is full when it has an empty room every Tuesday afternoon.
Multiply by every room you have and you have the practice figure. Four operatories open eight hours a day, five days a week, is 160 open chair hours in a week — whether or not somebody was rostered into all four.
Step two: used time
Used time is the hours a patient was actually in the chair. Not the hours that were booked. Booked time is a plan, and a plan that ends twenty minutes early is twenty minutes you did not use.
For a hand count, used time is the clock time between seating a patient and dismissing them, whether the appointment was supposed to be forty minutes or sixty. The gap between booked and actual is worth measuring separately, and we will come back to it.
Step three: dead time
Dead time is open chair time minus used time. It is not a moral judgment; some of it is unavoidable. It is simply the hours a room stood ready with nobody in it while the practice was open.
Dead time has three sources, and they need different responses:
- Unbooked time. The slot was never filled. This is a scheduling and recall problem.
- Lost time. The slot was booked and the patient canceled, failed to show, or arrived so late the appointment moved. This is a confirmation and policy problem.
- Turnover. The room was occupied by the work of resetting it rather than by a patient. This is a workflow problem, and it is the one most practices have never measured.
Step four: turnover
Turnover is the time between one patient leaving a room and the next patient being seated in it. It belongs inside dead time, but it deserves its own line because it is the portion you can shorten without booking a single extra patient.
Measure it from dismissed to next seated, per room. A few minutes is normal and necessary. A recurring half hour on the same chair, on the same afternoon, every week, is capacity you are paying rent on.
A worked example
These are example numbers, not benchmarks. Use them to check that your arithmetic works, then replace every figure with your own.
A four-operatory practice, open 8 a.m. to 5 p.m. with an hour for lunch, five days a week.
- Open chair time: 4 rooms x 8 hours x 5 days = 160 hours
- Used time, from seated-to-dismissed records: 101 hours
- Utilization: 101 / 160 = 63%
- Dead time: 59 hours
Then split the dead time:
- Turnover, 4 rooms x about 18 visits each x 13 minutes: about 15.6 hours
- Late cancellations and failed appointments, from the front desk’s own list: 11 hours
- Unbooked slots, the remainder: about 32 hours
That last line changes the conversation. Before the split, the practice has a vague sense that it is “pretty busy.” After it, the practice knows that four full working days of chair time went unbooked in a single week, and that a further two days went to resetting rooms.
The other percentage, and why it is not this one
There is a second question a practice asks about chair time, and it deserves its own number rather than a quarrel with this one: did the schedule we planned get filled? That is booked hours over rostered hours, and a chair nobody was rostered into does not count against it, because it is not an empty chair — it is a chair you did not open.
Utilization asks where the day went. Schedule filled asks whether the schedule is full. A practice with four chairs and two providers is not half idle; it is fully booked on two chairs, and both numbers are true. Keep them side by side and never average them — the average is over two different denominators and means nothing.
A third figure wears the same word on a different page. One person’s own utilization is measured over the rooms they used, on the days they worked, because counting every operatory in the building would penalize a hygienist for the rooms they never enter. It will not match the practice figure, and it is not meant to.
The patterns that matter more than the headline number
A single practice-wide utilization figure is a starting point and nothing more. The useful work is in the breakdowns.
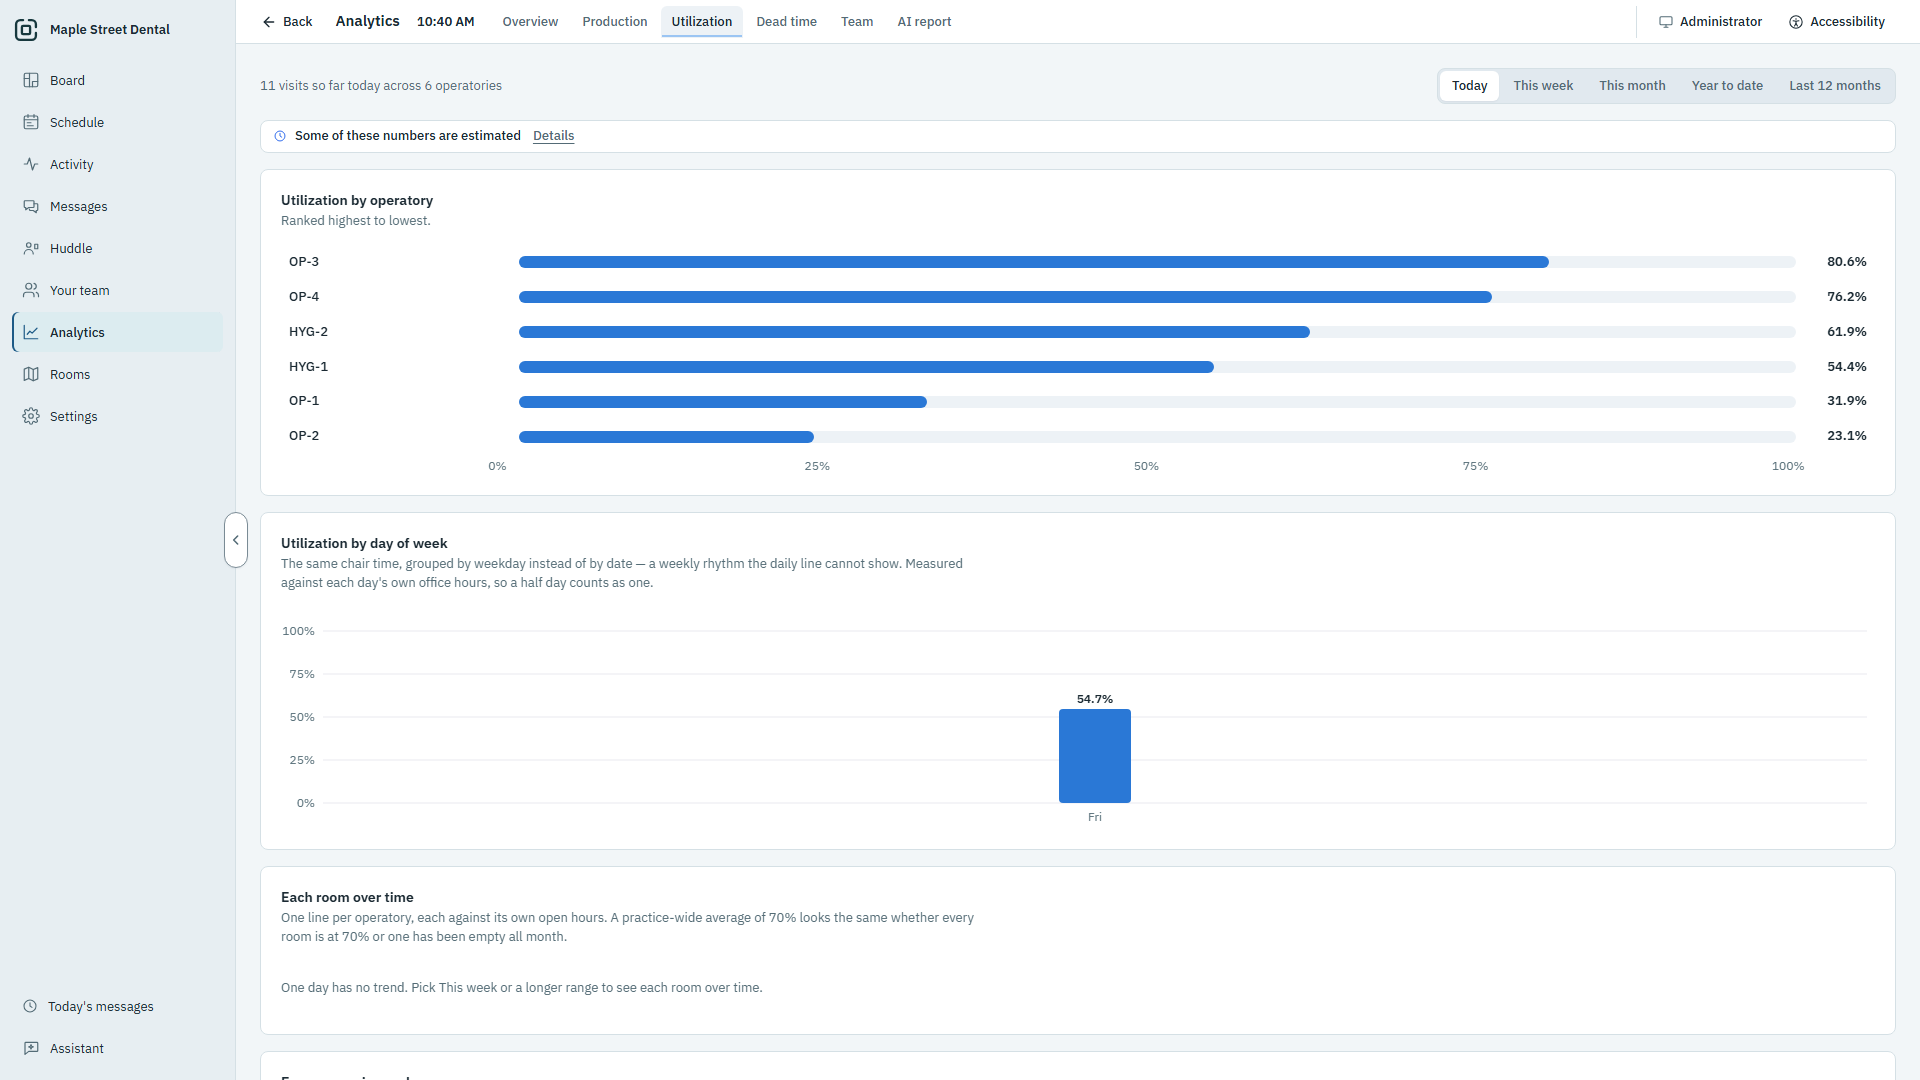
By operatory. Rank your rooms highest to lowest. A room ten or fifteen points below the others is rarely a mystery once you look: it is the furthest from the sterilization area, it is the one without the right equipment, or it is the one nobody assigns because it was the overflow room three years ago and the habit stuck.
By day of the week. Most practices have one soft day. Knowing which one turns a general worry into a specific decision about hours, staffing or where to steer recall.
By hour. This is where the real gaps hide. A practice can look reasonable across the week and still have every room empty between 2 p.m. and 3 p.m. on three days out of five. Laid out as a grid of days against hours, that block is visible in a second.
By provider. Not to rank people. Two providers can run identical schedules and finish very differently, and the pacing difference is information: one may be booked at intervals that do not match how long their work actually takes.
By procedure. The same procedure code booked at the same length across the practice may run consistently long or consistently short. Ten minutes of drift on a procedure you do fifteen times a week is two and a half hours.
Measuring it by hand for one week
You do not need software to start. You need a clipboard on each operatory and one week of discipline.
One sheet per operatory, four clock times per visit: when the patient sat down, when they got up, when the room was ready again, and when the next patient sat down. Whoever is in the room writes them. Nothing that identifies a patient goes on the sheet; a room and four times is the whole record. The turnover article sets out the same study in more detail.
At the end of the week, add the seated-to-dismissed minutes for used time and the dismissed-to- seated minutes for turnover, then divide by the open chair hours from step one. It takes an hour with a spreadsheet and tells you more than a year of impressions.
The catch is that it is a snapshot. One week can be an unusual week, and nobody keeps writing on the clipboard past the third day of a busy month. That is the honest limit of the manual method.
Common mistakes
- Counting booked time as used time. This makes a practice with a chronic early-finish problem look fully utilized.
- Removing rooms from the denominator because nobody was rostered in them. The room exists and it costs money.
- Comparing your number to somebody else’s. Definitions vary enough that cross-practice comparison is close to meaningless. Compare yourself to yourself, month over month.
- Chasing the average instead of the pattern. Raising a 63% average by a point is abstract. Filling a recurring empty Tuesday afternoon is a decision you can actually make.
- Measuring once. Utilization is a trend. A single month tells you where you are, not what is changing.
Where the numbers can come from
Most of what you need is already being written down as your team works. Open Dental carries an arrived, a seated and a dismissed time on each appointment, filled in as somebody marks each step. The obstacle is rarely that the times do not exist; it is that pulling them into a usable shape by hand is a job nobody has time for twice.
That is the gap OperatoryView fills. It is compatible with Open Dental and reads it through Open Dental’s own API, read-only, and turns those timestamps into utilization by room, dead time by day and hour, turnover and pacing without anyone typing anything. Its utilization is over your open hours and every room on your Board, and the section beneath those charts — Booked against the hours you rostered — is the other percentage, kept separate. The analytics page shows each of these breakdowns, and the feature set. Because none of it needs a patient identifier, none is stored: what is kept and what never leaves a practice running Open Dental is written down.
Start with the clipboard. It costs a week and it will tell you whether the number is worth watching every month.